Horizontal & Vertical Analysis
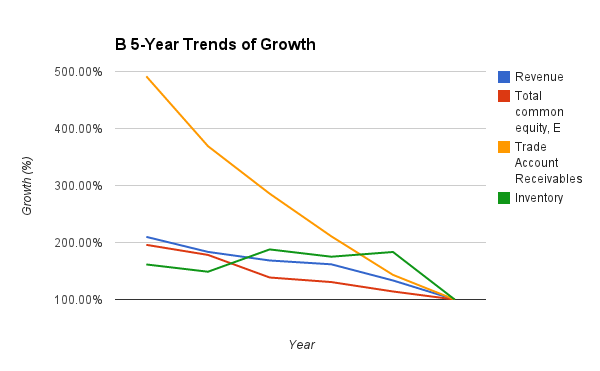
Table 1 - Table 4 in the appendix sections shows the trend of APOLLO’s and LONBISC’s balance sheet from 2008 to 2013. Figure 1 and Figure 2 in the appendix depicts the trend of its growth in revenue, equity, receivables and inventories.
Cash
APOLLO's cash and cash equivalent grew by 578% in 5 years, or a CAGR of 46.67%. However, part of the cash is converted from marketable securities as the marketable securities become 0 on year 2013. In view of this, it will be more meaningful if we examine the growth rate for the cash & short term investment. It show us a 98% of growth with a CAGR of 14.55% This indicate that the business is generating cash. This is despite it have been giving reasonable good dividends (> 4% D.Y.) every year.
LONBISC's cash and cash equivalent have a negative growth of -3.66% (CAGR -0.72%) over the last 5 years. And, LONBISC pay a minimal dividend (DY 1.2%) with dividend payout ratio < 30% for past 5 years. LONBISC seem not able to generate cash from its business. And, the more
worrisome part is LONBISC Cash/Total Debt is 12%. Does LONBISC have enough cash to serve it's debt?
Equity
APOLLO's equity increases by 30%, or a CAGR of 5.39%. Including the 4% dividend yield, the total value created in term of book value and dividend yield is 9.39% a year since 5 years ago. This is below the return of the broad market over the same period of 12.5%.
LONBISC's equity increases by 95.88% and a 0 retained earnings. The increase is contribute from the increase if common stock (82.23%) and reserve (273.57%). This show that the company have been raising fund from equity but not create value through it operations.
Inventory
APOLLO’s inventory increased 72.56% (CAGR 11.53%), while the revenue increase 22.97% (CAGR 4.22%). However, the inventory is 7.76% of the total assets and it is align with its previous years records. In view of the revenue is growing up, I believe the inventory increased is due to higher anticipated sales. Anywhere, investor need to monitor closely on the revenue growth and inventory level on next financial result to confirm the assumption.
LONBISC’s inventory increased 61.48% (CAGR 10.06%), while the revenue increase 109.88% (CAGR 15.98%). And, the inventory is only a 4.26% of the total assets and it is lowest in the history. It seem LONBISC have a better result in inventory management than LONBISC.
Trade receivables
APOLLO’s Trade receivables on year 2013 is 14.33% of total asset is slightly higher compare to its historical range. It may mean its customers are taking a little bit longer to pay. However, the growth in trade receivables at 16.08% (CAGR 3.03%) and is lower than the revenue growth rate of 22.97% (CAGR 4.22%). This show us the sales proceeds are collected and converted to cash, as evidence from the increase in cash and cash equivalent.
While, company’s B trade receivables is only 11.44% of total asset, but it is the highest if compare to its historical value. Its customers might take a little bit longer to pay. And, the growth in trade receivable is 391.51% (CAGR 37.50%) while the revenue is only increase 109.88% (CAGR 15.98%). The trend is worrying and it might show take the company might not able to collect the sales proceeds from its customers.
PPE
The amount of company’s A property, plant and equipment is increasing on 37.62% with a CAGR of 6.60% and the growth rate is much more faster than the revenue growth rate of 22.97% (CAGR 4.22%). It show that the company need more CAPEX to increase sales, and might not able to turn the net profit to free cash flow easily.
For LONBISC, the PPE is increasing on 127.32% with a CAGR of 17.85% and the growth is slightly faster than the revenue growth of 109.88% (CAGR 15.98%). Company seem need CAPEX to increase revenue and might not able generate free cash flow easily.
Share Capital & Debt
Over the years, APOLLO’s share capital is constant and thus, there is no dilution of its earnings per share. And, there is no long term debt on APOLLO, it show that APOLLO is using it’s own generated fund to sponsor the growth. This shows there is little risk in investing in its stock.
But, LONBISC’s share capital is increasing on 82.23% and there is a huge dilution on its earnings. LONBISC is paring down it’s long term loan but the short term is loan is growing on 60.35%. It seem that LONBISC not able to generate fund to sponsor the growth and it might need additional fund (from equity or debt) to fund its growth. The risk in investing in LONBISC is higher than APOLLO
Investors of APOLLO have been collecting net income in the form of dividend each year. Whereas shareholders of B has to fork out more money overall into this company. LONBISC’s unabated increase in debts (debts include all long and short term borrowings, hire purchase, bankers acceptance, overdrafts, and term loans) is very alarming!
Asset breakdown
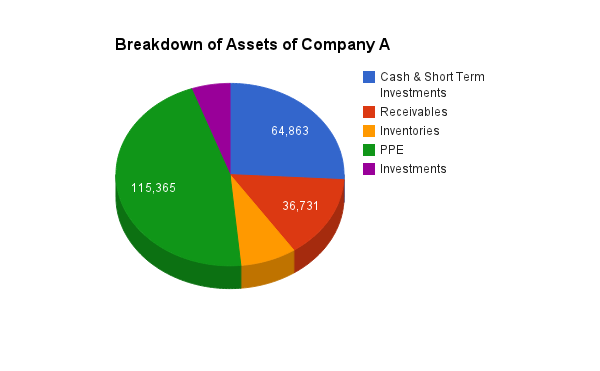
Figure 3 and Figure 4 depicts the breakdown of the total assets of APOLLO and LONBISC respectively.The total assets of APOLLO is made up of 25.31% cash & short term investment, PPE 45%, receivables 14.33%, and inventories 7.76%. The total assets of LONBISC consists of 4.19% of cash & short term investment, PPE 74.34%, receivables 13.15%, and inventories 4.18%. Why must LONBISC require such a high outlay of fixed assets and burdening its balance sheet?
APOLLO have better quality of its assets if compare to LONBISC.
Ratio Analysis
Liquidity risk
APOLLO has excellent liquidity ratios with current ratio 13.77 times and a quick ratio 11.48 times More than 50% of the current asset is cash & cash equivalents and it has no problem at all to pay its short term obligations.
LONBISC’s current ratio and quick ratio is 0.62 and 0.49 respectively. Both ratios are fall below 1.0, and it indicate that LONBISC might have difficulity to repay all its current liabilities. LONBISC is in very high risk if the economy turns for the worse, and if there
is another currency crisis with this type of liquidity ratio.
Long Term Financial Strength
APOLLO debt/equity ratio is 0 (< 2) and financial leverage ratio is 1.11(< 3), and in fact APOLLO has no short-term nor long-term loan at all. APOLLO hence will have no trouble paying creditors as well as obtaining additional long-term funding when needed. Instead it has excess cash of about 56m, or 70 sen per share which can be distributed to shareholders without any significant adverse effect on its operations.
LONBISC debt/equity ratio is 0.13 (< 2) and financial leverage ratio is 1.88(< 3). The financial leverage of LONBISC is not fully leverage yet and LONBISC might able to raise more fund from debt in future. Although this ratio is still not that big compared to the benchmark of 2 or 3, but the fact that B doesn’t produce any FCF to service the interest payment is alarming.
It clearly show that APOLLO have a better long term financial strength than LONBISC.
Conclusions
APOLLO has a healthy balance sheet. The trend of APOLLO’s balance sheet shows a healthy growth of its cash, equity, receivables and inventories. It has no debt, with high liquidity and financial strength ratios. The quality of its assets is high. Hence APOLLO presents a low risk investment option.
While LONBISC balance sheet is not as healthy as APOLLO, the trend of cash and receivables is worrying and it might need to raise cash via equity or debt if the situation not improving.
Appendix
Year
|
2013
|
2012
|
2011
|
2010
|
2009
|
|
CAGR
|
Assets
|
|
|
|
|
|
|
|
Current asset
|
|
|
|
|
|
|
|
Cash and cash equivalent
|
976.56%
|
220.73%
|
275.49%
|
163.75%
|
100.00%
|
|
77%
|
Marketable securities
|
0.00%
|
115.78%
|
102.31%
|
142.56%
|
100.00%
|
|
-100%
|
Trade Account Receivables
|
172.48%
|
123.13%
|
108.72%
|
96.14%
|
100.00%
|
|
15%
|
Other receivables
|
0.00%
|
290.76%
|
116.39%
|
203.08%
|
100.00%
|
|
-100%
|
Inventories
|
162.95%
|
141.05%
|
154.53%
|
119.34%
|
100.00%
|
|
13%
|
Tax refundable
|
5.66%
|
6.23%
|
19.55%
|
47.90%
|
100.00%
|
|
-51%
|
Total current assets
|
146.02%
|
123.52%
|
119.41%
|
122.66%
|
100.00%
|
|
10%
|
|
|
|
|
|
|
|
|
Cash & Short Term
Investment
|
151.34%
|
132.04%
|
129.15%
|
145.84%
|
100.00%
|
|
11%
|
|
|
|
|
|
|
|
|
Non-current assets
|
|
|
|
|
|
|
|
Property, plant and
equipment
|
126.50%
|
129.51%
|
127.72%
|
108.53%
|
100.00%
|
|
6%
|
Investment properties
|
103.03%
|
104.63%
|
106.22%
|
99.03%
|
100.00%
|
|
1%
|
Leasehold land use rights
|
12.16%
|
26.18%
|
27.97%
|
127.09%
|
100.00%
|
|
-41%
|
Goodwill
|
-
|
-
|
-
|
-
|
-
|
|
-
|
Deferred tax
|
352.00%
|
372.00%
|
144.00%
|
28.00%
|
100.00%
|
|
37%
|
Other non-current assets
|
30.88%
|
21.20%
|
6.73%
|
7.27%
|
100.00%
|
|
-25%
|
Total non-current assets
|
105.78%
|
108.10%
|
105.54%
|
98.20%
|
100.00%
|
|
1%
|
|
|
|
|
|
|
|
|
Total Assets, TA
|
121.73%
|
114.21%
|
111.04%
|
107.90%
|
100.00%
|
|
5%
|
|
|
|
|
|
|
|
|
Liabilities
|
|
|
|
|
|
|
|
Current liabilities
|
|
|
|
|
|
|
|
Short-term loan
|
|
|
|
|
|
|
|
Trade Account Payable
|
408.73%
|
212.57%
|
246.33%
|
180.54%
|
100.00%
|
|
42%
|
Other payables and
accruals
|
2.15%
|
90.92%
|
89.50%
|
81.39%
|
100.00%
|
|
-62%
|
Current tax payable
|
829.80%
|
132.32%
|
98.48%
|
483.84%
|
100.00%
|
|
70%
|
Other current liabilities
|
0.00%
|
305.88%
|
394.12%
|
4058.82%
|
100.00%
|
|
-100%
|
Total current
liabilities, CL
|
149.69%
|
128.78%
|
136.90%
|
135.53%
|
100.00%
|
|
11%
|
|
|
|
|
|
|
|
|
Non-current liabilities
|
|
|
|
|
|
|
|
Long-term loan
|
|
|
|
|
|
|
|
Retirement benefits
|
92.68%
|
85.37%
|
79.08%
|
72.91%
|
100.00%
|
|
-2%
|
Deferred tax
|
112.21%
|
116.36%
|
113.53%
|
105.43%
|
100.00%
|
|
3%
|
Total non-current
liabilities
|
110.14%
|
113.09%
|
109.89%
|
101.99%
|
100.00%
|
|
2%
|
|
|
|
|
|
|
|
|
Total liabilities
|
120.98%
|
117.39%
|
117.29%
|
111.18%
|
100.00%
|
|
5%
|
|
|
|
|
|
|
|
|
Equity
|
|
|
|
|
|
|
|
Share capital
|
100.00%
|
100.00%
|
100.00%
|
100.00%
|
100.00%
|
|
0%
|
Share premium
|
-
|
-
|
-
|
-
|
-
|
|
-
|
Other reserves
|
-
|
-
|
-
|
-
|
-
|
|
-
|
Retained earnings
|
133.68%
|
124.02%
|
117.91%
|
113.04%
|
100.00%
|
|
8%
|
Total common equity, E
|
121.81%
|
113.85%
|
110.33%
|
107.52%
|
100.00%
|
|
5%
|
|
-
|
-
|
-
|
-
|
-
|
|
|
Total liabilities and
common equity
|
121.73%
|
114.21%
|
111.04%
|
107.90%
|
100.00%
|
|
5%
|
|
-
|
-
|
-
|
-
|
-
|
|
|
Par value of share, RM
|
100.00%
|
100.00%
|
100.00%
|
100.00%
|
100.00%
|
|
0%
|
NOSH
|
100.00%
|
100.00%
|
100.00%
|
100.00%
|
100.00%
|
|
0%
|
|
-
|
-
|
-
|
-
|
-
|
|
|
Excess Cash
|
151.61%
|
132.57%
|
127.91%
|
147.49%
|
100.00%
|
|
11%
|
Excess Cash (Per Share)
|
151.61%
|
132.57%
|
127.91%
|
147.49%
|
100.00%
|
|
11%
|
Table 1: Horizontal Analysis of APOLLO
Year
|
2013
|
2012
|
2011
|
2010
|
2009
|
|
CAGR
|
Assets
|
|
|
|
|
|
|
|
Current asset
|
|
|
|
|
|
|
|
Cash and cash equivalent
|
172.16%
|
121.07%
|
149.62%
|
135.39%
|
100.00%
|
|
15%
|
Marketable securities
|
-
|
-
|
-
|
-
|
-
|
|
-
|
Trade Account Receivables
|
343.29%
|
257.72%
|
199.54%
|
147.25%
|
100.00%
|
|
36%
|
Other receivables
|
57.44%
|
65.44%
|
183.00%
|
90.15%
|
100.00%
|
|
-13%
|
Inventories
|
88.07%
|
81.12%
|
102.46%
|
95.48%
|
100.00%
|
|
-3%
|
Assets held for dales
|
-
|
-
|
-
|
-
|
-
|
|
-
|
Total current assets
|
157.92%
|
126.33%
|
237.33%
|
113.25%
|
100.00%
|
|
12%
|
|
-
|
-
|
-
|
-
|
-
|
|
|
Cash & Short Term
Investment
|
184.56%
|
121.07%
|
653.68%
|
135.39%
|
100.00%
|
|
17%
|
|
-
|
-
|
-
|
-
|
-
|
|
|
Non-current assets
|
-
|
-
|
-
|
-
|
-
|
|
|
Property, plant and
equipment
|
164.46%
|
151.74%
|
114.87%
|
110.87%
|
100.00%
|
|
13%
|
Prepaid land lease
payments
|
0.00%
|
0.00%
|
0.00%
|
97.74%
|
100.00%
|
|
-100%
|
Investment properties
|
-
|
-
|
-
|
-
|
-
|
|
-
|
Investments in associates
|
0.00%
|
0.00%
|
0.00%
|
137.63%
|
100.00%
|
|
-100%
|
Intangible assets
|
100.00%
|
100.00%
|
100.00%
|
100.00%
|
100.00%
|
|
0%
|
Investments
|
14.98%
|
14.28%
|
18.59%
|
89.88%
|
100.00%
|
|
-38%
|
Total non-current assets
|
151.19%
|
140.31%
|
107.21%
|
111.06%
|
100.00%
|
|
11%
|
|
-
|
-
|
-
|
-
|
-
|
|
|
Total Assets, TA
|
152.61%
|
137.35%
|
134.78%
|
111.53%
|
100.00%
|
|
11%
|
|
-
|
-
|
-
|
-
|
-
|
|
|
Liabilities
|
-
|
-
|
-
|
-
|
-
|
|
|
Current liabilities
|
-
|
-
|
-
|
-
|
-
|
|
|
Short-term loan
|
169.68%
|
137.44%
|
125.48%
|
77.78%
|
100.00%
|
|
|
Hire purchase creditors
|
94.04%
|
127.69%
|
122.02%
|
115.54%
|
100.00%
|
|
-2%
|
Trade Account Payable
|
147.54%
|
132.38%
|
166.07%
|
172.11%
|
100.00%
|
|
10%
|
Current tax payable
|
0.00%
|
4.40%
|
4.00%
|
2466.00%
|
100.00%
|
|
-100%
|
Liabilities related with
investment held for sale
|
-
|
-
|
-
|
-
|
-
|
|
-
|
Other current liabilities
|
109.48%
|
87.26%
|
106.90%
|
0.00%
|
100.00%
|
|
2%
|
Total current
liabilities, CL
|
156.75%
|
133.19%
|
155.49%
|
98.68%
|
100.00%
|
|
|
|
-
|
-
|
-
|
-
|
-
|
|
|
Non-current liabilities
|
-
|
-
|
-
|
-
|
-
|
|
|
Long-term loan
|
120.46%
|
146.29%
|
130.87%
|
175.47%
|
100.00%
|
|
5%
|
Retirement benefits
|
78.56%
|
55.27%
|
60.92%
|
86.85%
|
100.00%
|
|
-6%
|
Deferred tax
|
266.49%
|
114.57%
|
95.89%
|
59.71%
|
100.00%
|
|
28%
|
Total non-current
liabilities
|
107.87%
|
107.85%
|
100.99%
|
135.34%
|
100.00%
|
|
|
|
-
|
-
|
-
|
-
|
-
|
|
-
|
Total liabilities
|
141.07%
|
125.06%
|
138.01%
|
110.44%
|
100.00%
|
|
|
|
-
|
-
|
-
|
-
|
-
|
|
|
Equity
|
-
|
-
|
-
|
-
|
-
|
|
-
|
Share capital
|
182.23%
|
169.93%
|
123.02%
|
123.02%
|
100.00%
|
|
16%
|
Share premium
|
-
|
-
|
-
|
-
|
-
|
|
-
|
Other reserves
|
163.21%
|
145.11%
|
120.28%
|
107.55%
|
100.00%
|
|
13%
|
Retained earnings
|
-
|
-
|
-
|
-
|
-
|
|
-
|
Total common equity, E
|
171.74%
|
156.24%
|
121.51%
|
114.48%
|
100.00%
|
|
14%
|
Share application monies
|
-
|
-
|
-
|
-
|
-
|
|
-
|
Minority interest
|
137.14%
|
126.37%
|
154.22%
|
105.55%
|
100.00%
|
|
8%
|
Total Equity
|
164.40%
|
149.91%
|
131.39%
|
112.59%
|
100.00%
|
|
13%
|
|
-
|
-
|
-
|
-
|
-
|
|
-
|
Total liabilities and
common equity
|
152.58%
|
137.32%
|
134.75%
|
111.50%
|
100.00%
|
|
11%
|
Table 2: Horizontal Analysis of LONBISC
Year
|
2013
|
2012
|
2011
|
2010
|
2009
|
Assets
|
|
|
|
|
|
Current asset
|
|
|
|
|
|
Cash and cash equivalent
|
25.31%
|
6.10%
|
7.83%
|
4.79%
|
3.15%
|
Marketable securities
|
0.00%
|
17.44%
|
15.85%
|
22.73%
|
17.20%
|
Trade Account Receivables
|
14.33%
|
10.91%
|
9.90%
|
9.01%
|
10.12%
|
Other receivables
|
0.00%
|
1.10%
|
0.45%
|
0.81%
|
0.43%
|
Inventories
|
7.76%
|
7.16%
|
8.07%
|
6.41%
|
5.80%
|
Tax refundable
|
0.14%
|
0.16%
|
0.52%
|
1.30%
|
2.93%
|
Total current assets
|
47.54%
|
42.86%
|
42.62%
|
45.06%
|
39.63%
|
|
|
|
|
|
|
Cash & Short Term
Investment
|
25.31%
|
23.54%
|
23.68%
|
27.52%
|
20.36%
|
|
|
|
|
|
|
Non-current assets
|
|
|
|
|
|
Property, plant and
equipment
|
45.02%
|
49.12%
|
49.82%
|
43.57%
|
43.32%
|
Investment properties
|
5.36%
|
5.80%
|
6.06%
|
5.81%
|
6.33%
|
Leasehold land use rights
|
0.44%
|
1.00%
|
1.10%
|
5.13%
|
4.35%
|
Goodwill
|
0.00%
|
0.00%
|
0.00%
|
0.00%
|
0.00%
|
Deferred tax
|
0.03%
|
0.04%
|
0.02%
|
0.00%
|
0.01%
|
Other non-current assets
|
1.61%
|
1.18%
|
0.38%
|
0.43%
|
6.35%
|
Total non-current assets
|
52.46%
|
57.14%
|
57.38%
|
54.94%
|
60.37%
|
|
|
|
|
|
|
Total Assets, TA
|
100.00%
|
100.00%
|
100.00%
|
100.00%
|
100.00%
|
|
|
|
|
|
|
Liabilities
|
|
|
|
|
|
Current liabilities
|
|
|
|
|
|
Short-term loan
|
0.00%
|
0.00%
|
0.00%
|
0.00%
|
0.00%
|
Trade Account Payable
|
2.78%
|
1.54%
|
1.84%
|
1.38%
|
0.83%
|
Other payables and
accruals
|
0.03%
|
1.50%
|
1.51%
|
1.42%
|
1.88%
|
Current tax payable
|
0.64%
|
0.11%
|
0.08%
|
0.42%
|
0.09%
|
Other current liabilities
|
0.00%
|
0.02%
|
0.03%
|
0.30%
|
0.01%
|
Total current
liabilities, CL
|
3.45%
|
3.17%
|
3.46%
|
3.53%
|
2.81%
|
|
|
|
|
|
|
Non-current liabilities
|
|
|
|
|
|
Long-term loan
|
0.00%
|
0.00%
|
0.00%
|
0.00%
|
0.00%
|
Retirement benefits
|
0.60%
|
0.59%
|
0.56%
|
0.53%
|
0.79%
|
Deferred tax
|
6.13%
|
6.78%
|
6.80%
|
6.50%
|
6.65%
|
Total non-current
liabilities
|
6.73%
|
7.36%
|
7.36%
|
7.03%
|
7.44%
|
|
|
|
|
|
|
Total liabilities
|
10.18%
|
10.53%
|
10.82%
|
10.56%
|
10.24%
|
|
|
|
|
|
|
Equity
|
|
|
|
|
|
Share capital
|
31.22%
|
33.27%
|
34.22%
|
35.22%
|
38.00%
|
Share premium
|
0.00%
|
0.00%
|
0.00%
|
0.00%
|
0.00%
|
Other reserves
|
1.77%
|
0.00%
|
0.00%
|
0.00%
|
0.00%
|
Retained earnings
|
56.84%
|
56.20%
|
54.96%
|
54.23%
|
51.76%
|
Total common equity, E
|
89.82%
|
89.47%
|
89.18%
|
89.44%
|
89.76%
|
|
|
|
|
|
|
Total liabilities and
common equity
|
100.00%
|
100.00%
|
100.00%
|
100.00%
|
100.00%
|
Table 3: Vertical Analysis of APOLLO
Year
|
2013
|
2012
|
2011
|
2010
|
2009
|
Assets
|
|
|
|
|
|
Current asset
|
|
|
|
|
|
Cash and cash equivalent
|
3.98%
|
3.11%
|
3.92%
|
4.29%
|
3.53%
|
Marketable securities
|
0.00%
|
0.00%
|
0.00%
|
0.00%
|
0.00%
|
Trade Account Receivables
|
11.44%
|
9.54%
|
7.53%
|
6.71%
|
5.09%
|
Other receivables
|
1.95%
|
2.47%
|
7.04%
|
4.19%
|
5.19%
|
Inventories
|
4.26%
|
4.36%
|
5.61%
|
6.32%
|
7.38%
|
Assets held for dales
|
0.29%
|
0.00%
|
13.20%
|
0.00%
|
0.00%
|
Total current assets
|
21.92%
|
19.49%
|
37.30%
|
21.51%
|
21.18%
|
|
|
|
|
|
|
Cash & Short Term
Investment
|
4.27%
|
3.11%
|
17.12%
|
4.29%
|
3.53%
|
|
|
|
|
|
|
Non-current assets
|
|
|
|
|
|
Property, plant and
equipment
|
75.72%
|
77.63%
|
59.89%
|
69.85%
|
70.27%
|
Prepaid land lease
payments
|
0.00%
|
0.00%
|
0.00%
|
1.25%
|
1.42%
|
Investment properties
|
0.40%
|
0.72%
|
0.57%
|
0.00%
|
0.00%
|
Investments in associates
|
0.00%
|
0.00%
|
0.00%
|
4.00%
|
3.24%
|
Intangible assets
|
1.85%
|
2.06%
|
2.10%
|
2.54%
|
2.83%
|
Investments
|
0.10%
|
0.11%
|
0.15%
|
0.85%
|
1.05%
|
Total non-current assets
|
78.08%
|
80.51%
|
62.70%
|
78.49%
|
78.82%
|
|
|
|
|
|
|
Total Assets, TA
|
100.00%
|
100.00%
|
100.00%
|
100.00%
|
100.00%
|
|
|
|
|
|
|
Liabilities
|
|
|
|
|
|
Current liabilities
|
|
|
|
|
|
Short-term loan
|
26.32%
|
23.69%
|
22.04%
|
16.51%
|
23.68%
|
Hire purchase creditors
|
1.58%
|
2.39%
|
2.33%
|
2.66%
|
2.57%
|
Trade Account Payable
|
6.29%
|
6.28%
|
8.02%
|
10.05%
|
6.51%
|
Current tax payable
|
0.00%
|
0.00%
|
0.00%
|
1.23%
|
0.06%
|
Liabilities related with
investment held for sale
|
0.00%
|
0.00%
|
6.04%
|
0.00%
|
0.00%
|
Other current liabilities
|
1.16%
|
1.02%
|
1.28%
|
0.00%
|
1.61%
|
Total current
liabilities, CL
|
35.36%
|
33.38%
|
39.72%
|
30.46%
|
34.43%
|
|
|
|
|
|
|
Non-current liabilities
|
|
|
|
|
|
Long-term loan
|
7.15%
|
9.65%
|
8.79%
|
14.25%
|
9.06%
|
Retirement benefits
|
3.44%
|
2.69%
|
3.02%
|
5.21%
|
6.69%
|
Deferred tax
|
0.90%
|
0.43%
|
0.37%
|
0.28%
|
0.52%
|
Total non-current
liabilities
|
11.49%
|
12.77%
|
12.18%
|
19.73%
|
16.26%
|
|
|
|
|
|
|
Total liabilities
|
46.85%
|
46.15%
|
51.90%
|
50.19%
|
50.68%
|
|
|
|
|
|
|
Equity
|
|
|
|
|
|
Share capital
|
20.81%
|
21.57%
|
15.91%
|
19.23%
|
17.43%
|
Share premium
|
0.00%
|
0.00%
|
0.00%
|
0.00%
|
0.00%
|
Other reserves
|
22.94%
|
22.66%
|
19.14%
|
20.69%
|
21.45%
|
Retained earnings
|
0.00%
|
0.00%
|
0.00%
|
0.00%
|
0.00%
|
Total common equity, E
|
43.75%
|
44.23%
|
35.05%
|
39.91%
|
38.88%
|
Share application monies
|
0.00%
|
0.00%
|
1.08%
|
0.00%
|
0.00%
|
Minority interest
|
9.40%
|
9.62%
|
11.96%
|
9.90%
|
10.46%
|
Total Equity
|
53.15%
|
53.85%
|
48.10%
|
49.81%
|
49.34%
|
|
|
|
|
|
|
Total liabilities and
common equity
|
100.00%
|
100.00%
|
100.00%
|
100.00%
|
100.02%
|
Table 4: Vertical Analysis of LONBISC
Figure 1: APOLLO 5-Year Trends of Growth
Figure 2: Company B 5-Year Trends of Growth
Figure 3: Breakdown of Assets of APOLLO
Figure 4: Breakdown of Assets of Company B
References:-