Below table shows how
the Latest 5 Years ROE of APOLLO and LONBISC were achieved based on DuPont Analysis.
|
Year
|
2013
|
2012
|
2011
|
2010
|
2009
|
|
Net
Profit Margin
|
14.40%
|
10.84%
|
10.13%
|
15.47%
|
11.93%
|
|
Sales
Turnover
|
0.8692
|
0.8341
|
0.7541
|
0.7023
|
0.8328
|
|
Financial
Leverage
|
1.1133
|
1.1177
|
1.1213
|
1.1180
|
1.1141
|
|
ROE
|
13.94%
|
10.11%
|
8.56%
|
12.15%
|
11.07%
|
Table 1: ROE
for APOLLO
|
Year
|
2013
|
2012
|
2011
|
2010
|
2009
|
|
Net
Profit Margin
|
5.20%
|
5.43%
|
6.92%
|
8.09%
|
9.29%
|
|
Sales
Turnover
|
0.4244
|
0.4122
|
0.3857
|
0.4474
|
0.4116
|
|
Financial
Leverage
|
1.8815
|
1.8570
|
2.0790
|
2.0077
|
2.0269
|
|
ROE
|
4.15%
|
4.16%
|
5.55%
|
7.26%
|
7.75%
|
Table 2: ROE
for LONBISC
It is
clear from the table above that APOLLO has achieved a much higher ROE of 13.94%
compared to that of LONBISC of 4.15%. The higher ROE of APOLLO was achieved with
a relatively high income margin of 14.4% compare to LONBISC – 5.20% and higher
sales turnover (0.8692 vs 0.4244). Furthermore, APOLLO
was using a lower financial leverage of just 1. 11 compare to 1.88 of
LONBISC.
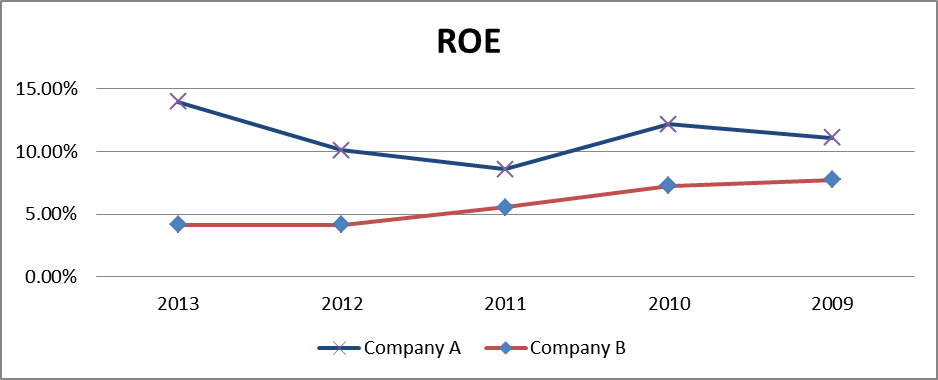
Figure 1:
Trends of ROE of APOLLO and LONBISC
Based on
the last 5 years results, the ROE for APOLLO is growing while LONBISC ROE is
shrinking. And, the growing of APOLLO’s ROE was achieved with growing Net Profit
Margin instead of other elements and this is the most desirable way to achieve a
higher ROE. While, LONBISC’s net profit margin is experiencing a negative growth
and this is the main contributor to the shrinkage of the
ROE.
|
A
|
B
| |
|
Short-term
loan
|
0
|
179,882
|
|
Long-term
loan
|
0
|
48,848
|
|
Hire
purchase creditors
|
0
|
10,823
|
|
Hire
purchase
|
0
|
23,523
|
|
Total
Debt
|
0
|
263,076
|
Table 3: Debt
for APOLLO vs LONBISC
|
A
|
B
| |
|
Cash
& Equivalents
|
64,863
|
27,210
|
|
Investment
- Securities
|
0
|
|
|
Current
Liabilities
|
134,436
|
241,617
|
|
Excess
Cash
|
0
|
0
|
Table 4:
Excess Cash for APOLLO vs LONBISC
Refer to
the Table 3, APOLLO is a debt free company and it can increase the financial
leverage and improves its ROE. However, financial leverage is a double edge
sword it can hurt ROE badly in the bad times. And, high leverage can make a
company’s balance sheet unhealthy and become risky during economy
downturn.
From the
above analysis, we can make a conclusion that APOLLO is much more efficient than
LONBISC as APOLLO have a higher ROE for the pass 5 year which achieved by higher
net profit margin, higher asset turnover and low financial leverage. Furthermore
APOLLO has an option to further increase the ROE by using financial
leverage.
References:-
No comments:
Post a Comment